Raw - Data handling
The Raw-Data Page contains information about the data that you have loaded to Scito and it also allows you to filter them to your needs before continuing with your project. It is separated in three main parts as highlighted in the image (Navigation Bar in yellow, Main Area in green and Left Panel in red) and each of them is described in more detail in the following sections.
Main Area
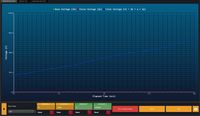
he Main area consists of 3 smaller views namely: Performance Curves, Detector View and Evaporation Rate Chart. The Performance Curves view is shown on the image to the left. It contains a graph where the change of voltage during the measurement is plotted. There are 3 series in this graph. The Base Voltage is painted in green, the Pusle Voltage in red and the Total Voltage in blue. Total voltage is calculated as the sum of the Base Voltage and the Pulse Voltage which is multiplied by the Pulse Coupling factor (machine parameter found in the .par file) [Vt = Vb + (Vp * a)]
Evaporation Rate Chart
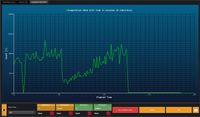
The Evaporation Rate Chart in the Main Area contains a graph where the number of evaporated events over time is plotted. The size of the bins is optimized automatically and the bins size is shown in the legend of the graph.
Detector Area
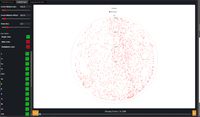
The Detector View in the Main Area displays the position where each event hit the detector. It is divided into windows and you can switch between windows using the Next and Preious buttons or the slider at the bottom. The text shows you which events are currently shown based on the order in which they were registered. Using the controls on the left you can change the window size, window offset and the point size. The window size is the number of events that are currently on display. The window offset is the number of events that will be skipped when moving to next window. If the window size and offset are equal then the next window will start where the current window ends. A lower offset means that some events shown in the next window will be the same as those in the current one. A higher offset will mean that events there will be events in between windows that will not be shown. The point size changes the radius of the points in the view. The color options allow you to change the color of the points. Single color gives all the points the same color and makes no distinction. Alloy color paints them based on what species they are. In order for it to work an alloy definition needs to be applied. Check the alloy page for more information on how to apply it. Multiplicity color will color events based on their multiplicity. To activate that you need to update the multiplpicity option. Check Multi Events section for more information. Below the color options a list of all species defined by you is displyed with a check box next to it. You can use this to show and hide events based on the species they belong to. In order to do that you first need to choose the alloy color option.
Left Panel
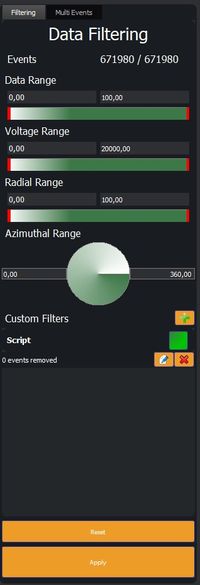
The left panel allows you to filter the data and to view information on event multiplicity. The first line shows the current number of events (after applying filters) and the total number of events that were loaded from the raw file. Below there are 4 predefined filters. Data range filter will filter out a percentage of the data based on the order that they were read in. The voltage range filter will filter out events based on their total voltage. Radial range filter will filter out events based on the distance from the center of the detector. Azimuthal range filter will filter out events based on their angle on the detector. Sometimes these filters are not enough. In that case Scito allows the opportunity to create your own custom filters. To add a new custom filter press the + button. To better understand how the custom filters work check the Custom Filter section below. Once adding a custom filter it will be shown in the custom filter list as in the image. Each custom filter will have a name and a checkbox that you can use to turn it on and off. Below the name the text will let you know how many events have been filtered out. Next to it there are 2 buttons. The edit button allows you to modify that filter and the delete button completely removes it. At the bottom of the Left Panel the Reset button can be used to reset the data to their initial state, while the Apply button with apply all the current filters (prdefined ones and custom ones that are turned on). Once the filters are applied then the pages on the right of the Raw-Data page need to be reviseted. It is also important to know that once you apply filters their will be applied to the full dataset. Tha means that if you have already applied a set of filter and then apply a new one, the new one will be applied on the full data not just the data from the last filter.
Custom Filter
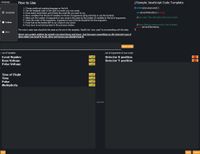
When adding a new custom filter or editting an existing one the dialog displayed on the image will be opened. Here you can change the filter details. On the top of the page you can choose the language in which you want to write the script. Instructions on how to create a scipt are also displyed on the How to Use section. On the right side a template is provided for your language of choice. Below there is a button for you to select the file where you script is. Below that there is a list of variable that you can use in your script. You can move variable by dragging them or pressing the + and x buttons. Add all the variables that you need for your script to the list on the right. The order in which the variable are is very important. In your script file copy the code provided above and keep the number of aruments in your function equal to the number of the variables that you selected. The script will run for every event. The variables which you selected will be will pass their data to the function of your script. Then you can write your code that will do the filtering. In the end you have to return a boolean variable (true/false), true means that the event will be filtered out while false means that it will be kept. Once you are done save the file where you wrote the script, load it using the Select Script button and make sure the correct variable are selected in the right order. At the bottom of the dialog there are 3 buttons. The Test button will let you run your script to see if it is correct and how many data it filters. This will not actually apply the filter but just test it. The Save button will save the changes to the custom filter while the Cancel button will not. If you are not good at programming then we understand that it can be hard to create such filters. You can use the Contact Us form in the Project page to ask for a script and we will be happy to help you with that.
Multi Events
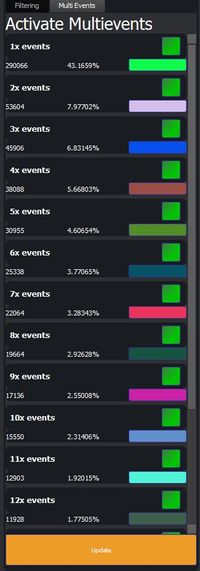
The Multi Event View in the Left Panel allows the use to check multiplicity information. 1x are the single events, 2x are the double events and so on. For each multiplicity you can check how many such tuples there are and what percentage of the total data they are. Next to this information is the color that will be used to draw those events in the Detector View. To view that color you need to select the multiplicity Color Option. The Checkbox above the color allows you to show or hide events from that group in the Detector View. When you make changes you need to click the Update button for those changes to take effect in the Detector View. Also use the Update button to view current information on the multiplicity, especially when you filter out data.
